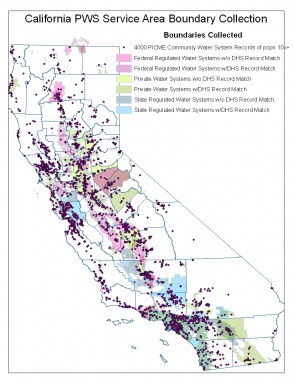
Some of the latest research conducted utilizing the boundaries collected through ICE and uploaded to the California Department of Public Health Environmental Health Tracking Program or CEHTP, the CDPH entity behind the creation of the online geographic tool.
The Information Center for the Environment (ICE) has enjoyed a long, lustrous relationship with the California Department of Public Health, (CDPH). One of our latest projects involves collecting drinking water service area boundaries for the state of California and creating a geospatial statewide dataset for CDPH use. Recently, the project has also caught the eye of CalWARN, a Wastewater Agency Response Network who is interested in the collection for emergency purposes. For example, in the event California experiences a Hurricane Katrina type catastrophe, this data will direct us to the most vulnerable water systems and cut off their distribution to prevent water supply contamination. However, California's drinking water systems come in a variety of categories.
| Small Water Systems, SWS | Serving 25+ connections |
| Local Small Water Systems, LSWS | Serving less than 5 connections/persons, for less than 60 days/year |
| State Small Water Systems, SSWS | Serving connections/person more than 5 but less than 15, for less than 60 days/year |
| Public Water System, PWS | Serving connections/persons more than 15 but less than 200 for 60+ days/year |
| Non-Transient Non-community, NTNCWS | Serving connections/persons more than 15 but less than 200 for 6 months/year, but can serve the same 25 or more people for 6 months or more |
| Transient Non-Community, TNCWS | Serving connections/persons more than 15 but less than 200 for 60+ days/year, but can serve ANY 25 or more people for 6 months or more per year |
| Community Water System, CWS | Serving connections/people 200+ all year long |
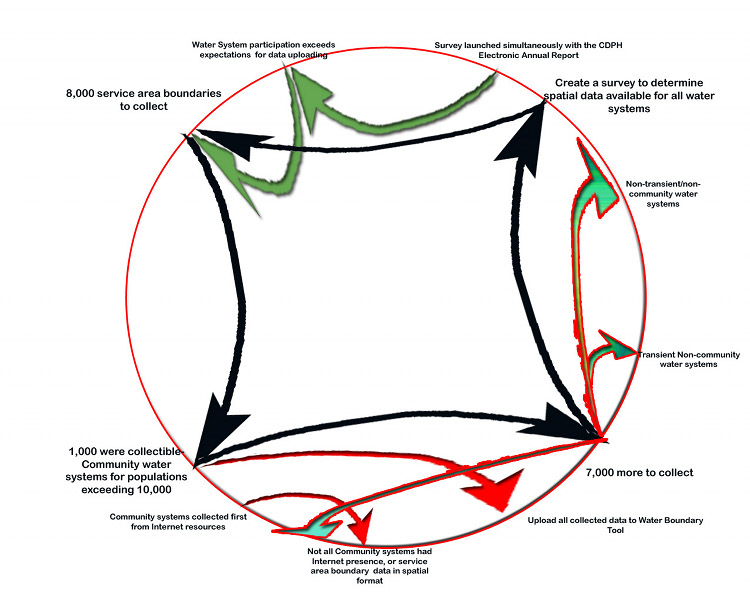
The search began with Community drinking water systems and we were fortunate that Cal Atlas (http://atlas.ca.gov/download.html) has spatial data for Community water systems with populations/connections exceeding 10,000. This made the early stages of collection uncomplicated and we downloaded data for 700 drinking water systems. However, we were about to embark on the more complicated aspect of the project: search for and obtain spatial data for those remaining systems not in Cal Atlas; that number: 8,000.
Examining the elements of this project told this story:

To collect the additional water system boundaries posed a daunting task as the majority of these systems were small with varying degrees of computing knowledge, expertise and equipment. Contacting drinking water systems via telephone and email was definitely the first step. We would discover that water systems changed management, changed names, larger water systems engulfed them and some systems made decisions through a parttime board of directors.
To gain an understanding of the types of data available from these water systems, a survey was launched to the water system managers to assess this question. We would launch the survey simultaneously with a yearly reminder from CDPH for systems to complete their annual reports. As suspected, the survey responses revealed an interesting amount of data variety. Each system was unique even though they were providing the same service. Collection came in the forms of GIS spatial data, PDF images of boundaries, paper map images of boundaries. The PDF images were geo-referenced and digitized; the paper map images were scanned to make a PDF version then were geo-referenced and digitized. To speed up the process and populate a new up and coming geographic tool, Google Earth Pro was used to create KML files. Maps were created in intervals to show collection progress and we would also share this data with another branch of CDPH, the creator of the new online geographic tool.
The California Department of Public Health Environmental Health Tracking Program or CEHTP, is the CDPH entity behind the creation of a new online geographic tool and with whom we share data and collaborate with. CEHTP developed, deployed and maintains a tool that houses the boundaries collected, http://www.ehib.org/page.jsp?page_key=61. This tool we fondly refer to as the WBT is called, the Drinking Water Systems Geographic Reporting Tool, and it has many purposes. They are:
- to produce a high resolution, digital map of drinking water system customer service areas for the entire state of California,
- to assist water systems in digitizing their customer service area boundaries and identify their neighboring systems and
- to create a geographic information system GIS layer to use for emergency preparedness, public health prevention and response and to research better and understand the relationship between drinking water, health and the environment
Our goal here was to have water system managers and personnel, upload their data to the WBT, or modify their boundary if it was previously uploaded. Additionally, we urged water system managers to submit any paper or electronic images of their boundaries, if they did not fit into 1 of the 2 categories above. The response from the survey launched was phenomenal and water system managers became really invovled. Their participation involved uploading their GIS data themselves, modifying their boundaries in the Tool and actually taking advantage of the option to draw their boundary from scratch. The number of boundaries in the Water Boundary Tool and our own spatial directory has jumped 25% since the survey launch. Those of us collecting drinking water service area boundaries call this: SUCCESS!!!

